Data-driven product management: An essential guide
Last updated: May 2024
You know that data matters. You know it is essential for setting goals. And you know it can bring greater clarity to your product decisions — helping you understand what is best for your product's success and the people who use it.
That much is straightforward. But for many product managers, putting these ideas into practice can be challenging. What types of data should you be looking at? And how do you make choices based on what you see? It takes effort to collect all the right data, and thinking strategically about it is one of the hardest parts of your job.
You also have to consider how to balance numbers against knowledge. Many folks believe that hard data is the most truthful and accurate measurement of success. Yes, data matters. But it is not the only thing that matters. Your values, vision, and experience are what give meaning to the metrics.
Analyze your product data with Aha! software. Start a free trial.

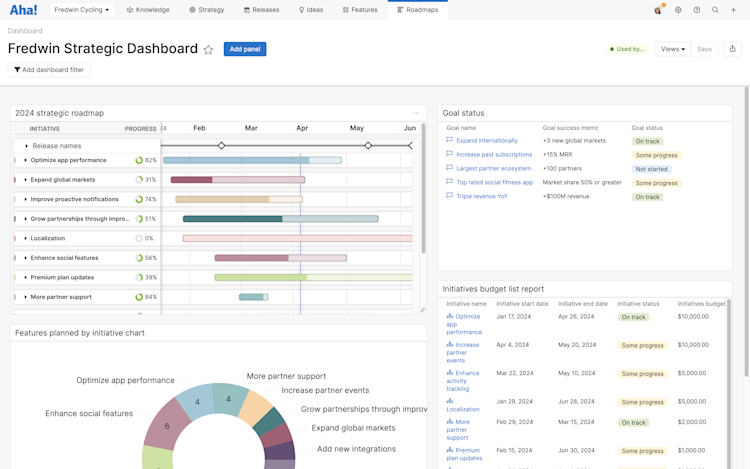
Monitor strategic performance and goal progress on a dashboard in Aha! Roadmaps.
If you are looking to take a more data-driven approach to product management, it will take more than running a few reports (although that is a great place to start). This guide will help you think about product data in a deeper way — including what to measure and how to glean meaningful insights. Let's get started:
Types of product data
Product data is a broad term. It can encompass everything from website traffic to feature usage and sprint velocity. Yet a few common themes emerge — broadly, product data offers insights into your customers, performance, and progress. It should help you answer questions like:
What problems are my customers trying to solve?
How is my product performing and contributing to the business?
How efficiently is the product team working to deliver the product?
The following table includes a brief overview of these three important "buckets" of product data and what kind of metrics and information each includes. Click into the guides linked within the table for a deeper dive into each type. (Keep in mind that the specific metrics and methods you use will vary based on your product and the resources available to you.)
Product data type | Why it matters | What information it includes |
Customer data | Helps you understand customers' needs, challenges, and goals — as well as their thoughts and feelings about using your product | Customer feedback collected via quantitative methods (polls, A/B tests, NPS scores, etc.), qualitative methods (interviews, forums, focus groups, etc.), or blended methods (like an ideas portal) Read more about customer data. |
Performance data | Highlights how your business and product are performing against goals and succeeding overall | Business metrics such as annual revenue and conversion costs, plus product usage metrics such as feature usage and daily active users Read more about product metrics and product analytics. |
Progress data | Shows the product team's efficiency in delivering against the roadmap and helps ensure accurate planning | Metrics such as percentage of work completed and number of features shipped, plus reports such as burndown charts Read more about progress reports. |

Monitoring these types of product data sets you up with a great baseline for making more informed product decisions. A well-rounded view of product data helps you keep everyone's best interests in mind — across your customers, business, and team — as you decide what to build next.
How to bring types of product data together
It is always a good idea to explore possibilities from various angles. But when you are looking at multiple types of product data, it becomes a lot to sift through — especially when data points appear to go in different directions. How do you synthesize it all?
It starts by coming together as a team. Product managers are not the only ones who care about data — leadership and other groups (including engineering, marketing, and support) rely on it too. They can help you discern what is most important to track and give input on the best ways to do so. Together, you will decide what to measure, how you will pull the data, and who is responsible for monitoring each data source.
From there, a framework can help you incorporate multiple data types into your decision-making. Take feature prioritization, for example. A simple 2x2 prioritization matrix lets you compare factors such as customer needs against concerns like development costs. You could also take a more disciplined approach by weighting and aggregating your data to balance multiple inputs.
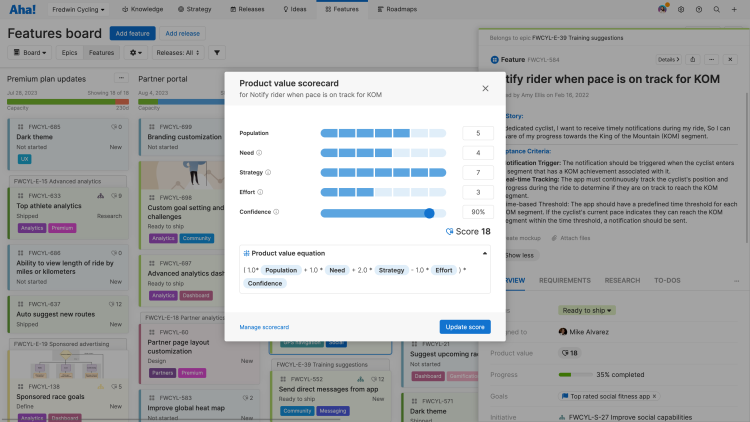
In Aha! software, you can do this with a product value scorecard. This is our way of bringing together a few key product data points into one objective overarching score that we can use to prioritize new functionality. The metrics we chose to include (e.g., population, need, and effort) are based on what we believe matters most to our success and ability to deliver product value. But you can customize it with your own metrics. Scorecards also help keep the process of including product data consistent and repeatable across the entire product team.

An example of how to incorporate multiple types of product data with a product value scorecard in Aha! Roadmaps
Read more: Introduction to the product value score
Tracking different types of product data
Once you have a shared understanding of the data you want to track and how you will bring it all together, it is worth going over the methods you will use to collect it. You want to be aligned on which tools you will use and agree on consistent parameters for pulling the data to ensure accuracy. This matters especially if you use multiple tools, as most product teams do. Google Analytics, in-app analytics, and product development software each help you measure different things.
The more you can consolidate, the better. It can be challenging — and certainly more cumbersome — to glean insights when you are looking at customer data in one tool and progress reports in another. You want to be mindful of how you organize this information.
It is helpful if you can analyze multiple types of product data in one place. (And if you guessed that we would use Aha! software as an example of how to do this, you are correct. We designed it with this need in mind).
Let's say you are a product manager working on a new feature, but you are not sure of the best way to design it. If you use Aha! software, here are some ways you could use product data to help inform your decision:
View tracked business OKRs to see which areas need improvement and how a new feature could support them
Conduct polls to get your customers' opinions on the proposed feature
Explore customer ideas with AI to analyze feedback trends and gauge the existing interest in this type of feature
Use list reports, pivot tables, and charts to get a clear view of what you have already delivered to customers
Create a capacity report to understand how much bandwidth your team has to build the new feature
Set a value score for the feature idea to estimate its impact
Visualize progress on a roadmap to track the feature's delivery once your plan is set
With all of this product data available in a single tool, it is much easier to analyze and incorporate it into your decisions. If you are curious to see some of this in action, check out the tutorial below.
Editor's note: Although the video below still shows core functionality within Aha! software, some of the interface might be out of date. View our knowledge base for the most updated insights into Aha! software.
Making better decisions with product data
Product data can offer a wealth of insight. But it does not reveal the whole picture on its own. As a product manager, it is up to you to dig into and interpret the real meaning behind it. This is also important for avoiding certain pitfalls. Data can sometimes be inaccurate or poorly sourced, or it might be accurate and still lead to poor assumptions. You have to look out for the truth.
For example, let's say you notice a spike in traffic to a support article on a recently released feature, coupled with decent initial feature usage. This could be an excellent sign that your feature is popular and your customers really want to use it. It could also mean that people are confused by how it works and are getting stuck as they try to figure it out. In this case, you might dig into other metrics for clues or even reach out to your customer success team members to get more context from what they are hearing.
Use your intuition. Investigating the "why" is how you pair product data with your expertise as a product manager — using both to guide your decisions. That is what data-driven product management is all about.
Read more: 4 smart ways to analyze product management team success
Why data-driven product management matters
In addition to supporting your daily product decisions, a data-driven approach matters in other ways too — all of which can help you be a better product manager. Here are some examples:
Goal achievement
Product data helps you keep a pulse on strategy. Most goal frameworks (e.g., OKRs and SMART goals) are time-bound and measurable. The closer you track your success metrics, the better you know how you are progressing against your goals — as well as what you could do to reach them faster.
Stakeholder alignment
Product managers work with multiple types of data, but also with multiple teams. Although this cross-functional collaboration is less quantifiable, it is crucial to successful product development. Bringing product data into your team discussions can help you be more productive, keeping everyone focused on the most pressing needs and problems to solve.
Product-building confidence
You cannot rely on product data alone. But you can use it to help validate what you feel is best for the product, uncover new ideas, or solve challenges when things are not progressing as you had hoped. Later on, product data helps you reflect on past decisions and understand what went well and what did not — so you can go boldly forward.
And remember: Data-driven product management is only effective when you have a clear vision in mind. Stick to it, and let product data be something that helps you cut through the fog along the way. Take that approach, and you might impress yourself with what you can achieve.