Just Launched! — Introducing Custom Equations in Aha! Reports
Are we on track to meet our revenue goals? Are the target dates realistic? What is the cost per lead? These are not simple questions. To truly provide meaningful answers, you need to combine different datasets and run sophisticated calculations. Since you have so much product and marketing data in Aha! already, it would be nice to do that analysis directly in the application. Now you can.
You can now perform calculations directly in Aha! list reports — so you can turn your product and marketing data into actionable insights.
Aha! is the single source of truth for your product and marketing data. You could already build most of the reports you need to inform your business decisions. But sometimes you need to run calculations on your data to understand the full story. This update gives you the ability to do exactly that — without ever leaving Aha!
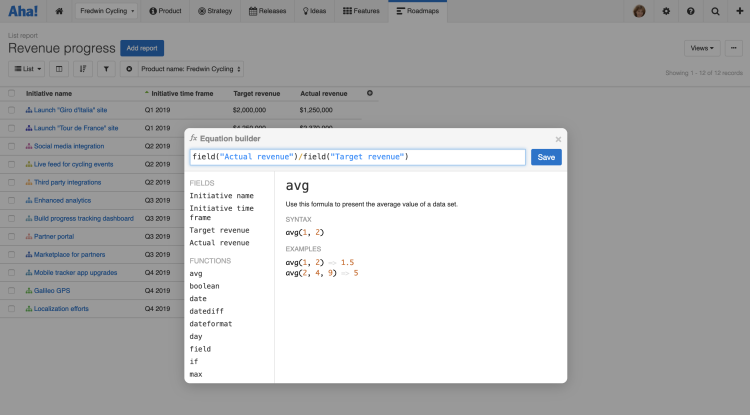
List reports now include the option to add a calculation column. When you add a calculation column, the equation builder modal opens. This is where you can combine field values with functions and operators to create a formula. You can do basic math (add, subtract, multiply, or divide) or create a more advanced calculation — such as the time between two dates.
Add as many calculation columns as you need to each list report. You can change the column name, sort the data, and format it based on your number and date preferences. You can also include calculated fields in pivot tables and charts.
Here are a few examples of the calculations you can now perform in Aha! to discover deeper insights:
Track progress against revenue goals Calculate the difference between the target and the actual results to understand how you are doing against your revenue goals. The screenshot below shows a list report for strategic product initiatives. In this example, we added a calculation column that divides the target revenue by the actual revenue to track progress as a percentage.
Set formatting preferences for number values including decimal places, percent, or currency.
Show the number of days to release Create a report showing the number of days, months, or years until features are released. In this example, we added a calculation column to a list report to determine the number of days between the due date and the current date. Then, we switched to a pivot table to better visualize the data. The newly calculated data automatically appears in the add data modal. Drag the data and place it in the columns, rows, or cells of the pivot table.
Here is the equation we used: datediff(today(),field(“Feature due date”),”day”)
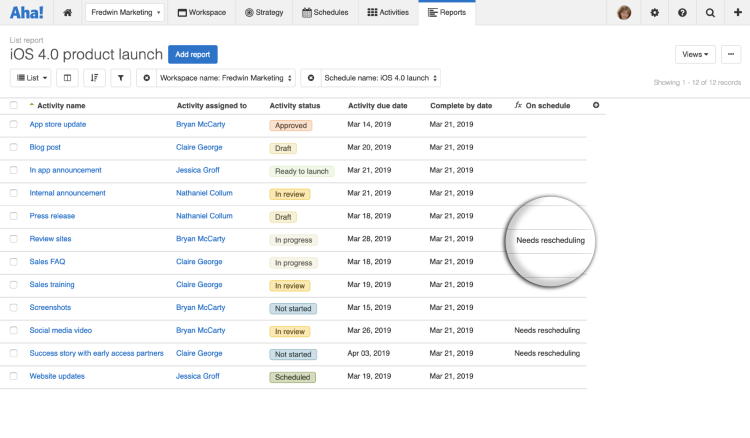
Keep all activities on track Calculate the difference between the launch date and the due date to see which marketing activities are behind schedule. In the example below, we used a logical function to evaluate if the due date is greater than the complete by date for each activity. If true, the value “Needs rescheduling” is presented in the calculated data field.

Here is the equation we used: if(field(“Activity due date”) field(“Complete by date”), “Needs rescheduling”,””)
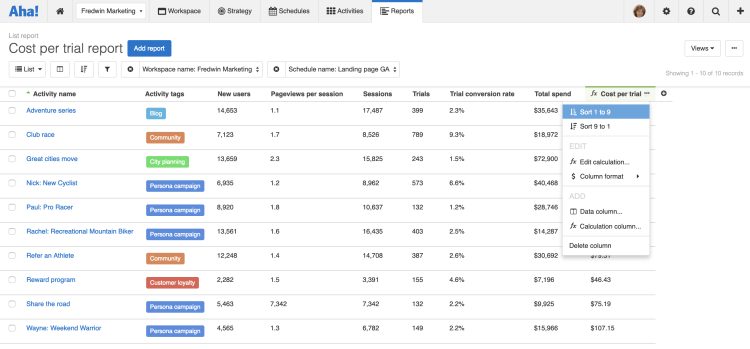
Analyze marketing ROI Compare the cost per lead across your marketing campaigns. In the example below, we used the integration between Aha! for Marketing and Google Analytics to measure landing page results. (Editor's note: The Google Analytics integration is no longer available due to Google’s deprecation of Universal Analytics. See release note.)We also added a custom field to capture the total spend for each campaign. The calculation column divides the total spend by the number of trial leads for each campaign.

Calculated columns can be sorted by ascending or descending field values.
You can report on more than 200 data columns in Aha! — along with unlimited custom fields.
Aha! provides the most powerful tool to create visual roadmaps and marketing plans and analyze program results via a built-in analytics engine. With this update, you can do even more with your data. Check out the new equation builder to answer complex questions and draw meaningful conclusions from your product and marketing data.
Sign up for a free Aha! trial — be happy The ability to do custom calculations in list reports is available to all Aha! customers. If you are not already an Aha! customer, you may want to sign up for a free 30-day trial or join a live demo to see why more than 250,000 users trust Aha! to set brilliant strategy, capture customer ideas, create visual roadmaps, and manage breakthrough marketing programs.
