Just Launched! — Improved Product Management Reporting and Analytics
Product managers have all the answers, right? Well, maybe not always. Sometimes you need a little visual aid to help explain, interpret, and deliver insights on those important product questions — which means you need to be able to find the right data to build reports quickly.
This is why we provide the most powerful product management analytics ever available. You can report on more than 200 data columns in Aha! (along with unlimited custom fields). But all that data could make it somewhat cumbersome to build complex reports. So, we wanted to make the experience a bit more enjoyable and intuitive.
Our new visual modal allows you to quickly search for and add data from multiple record types when creating reports in Aha!
The search functionality is especially helpful if you have lots of data. And visually, it is now clearer how that data is related and will be displayed. These improvements allow you to assemble the exact report you need — list views, pivot tables, charts, and of course roadmaps — faster. You can start by choosing from more than 70 example reports, and then customize them to the exact data and layout you need.
Let’s imagine that you want to build your own report from scratch. Here is how you can get started:
Create a new report When you create a new custom report, you are prompted to select a primary record type. This serves as the foundation for your report. For example, if you wish to create a list report that shows features with related releases and goals, you will want to choose features as your primary record type.
The primary record determines what additional data can be included in your report.
Search and filter for relevant data You want to show the right information to help answer those important product questions. The new search functionality in the modal helps you quickly isolate the right data. Start typing and the search results are automatically filtered. This is particularly helpful if you have lots of custom fields.
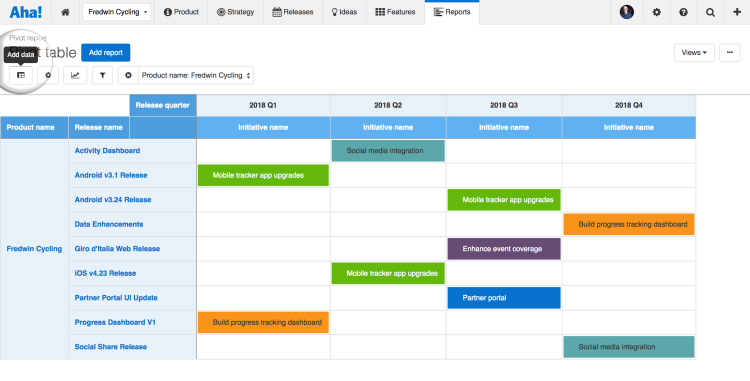
Customize any report by clicking on the Add data modal.
Include data from other record types The new user experience is most impactful when adding multiple record types. The visual representation of how the data is related also makes it easy to understand the structure of the report and to modify the information that is included.
You can now add multiple columns across different record types at once.
Aha! provides the most powerful and comprehensive product management reporting and analytics available — so you can quickly answer all those burning questions.
If you need any help crafting reports in Aha! (or would like to learn more) contact us at support@aha.io. An experienced product management expert from our Customer Success team will respond quickly.
Sign up for a free Aha! trial — be happy Reports and analytics are available to all Aha! customers. If you are not already an Aha! customer, you may want to sign up for a free 30-day trial of Aha! now to see why more than 150,000 users trust Aha! to set product strategy, create visual roadmaps, and prioritize releases and features.
