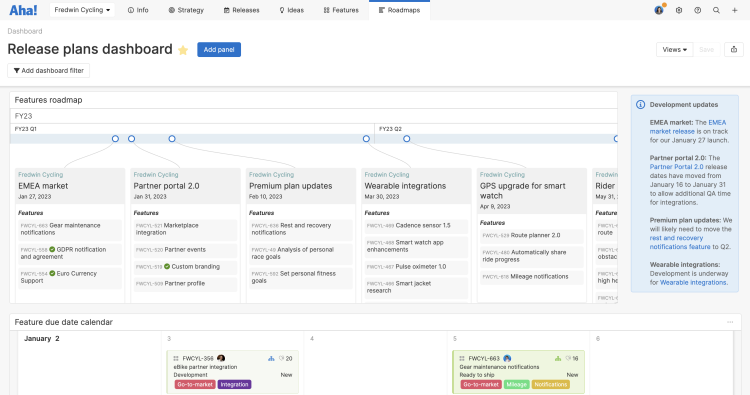
Release plans dashboard created in Aha! Roadmaps.
7 New Roadmaps and Reports for Dashboards
Have you built a dashboard in Aha! Roadmaps yet? You can combine multiple reports into a single view to show how your product is progressing. And since dashboards are interactive, you can click in to further explore the details and data behind the view. It is helpful (and even downright fun) to get insights at a glance, then drill into the specifics of what you care about. With this week's launch, you have several new options to create even more informative dashboards.
Today, you have access to seven new panel types to build out your dashboards in Aha! Roadmaps and share a complete view of plans and progress.
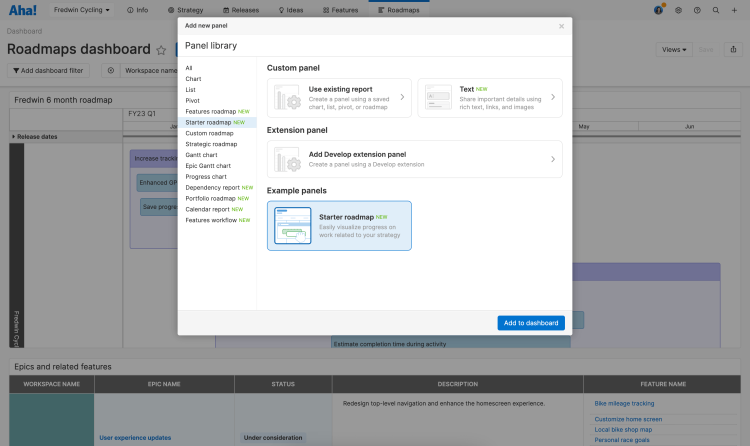
You could already include charts, lists, pivot tables, and a variety of roadmaps as panels in a dashboard. Today's enhancement gives you even more options. Insert a portfolio, starter, or features roadmap to highlight the timing of your plans, add a calendar view to communicate key dates, and include the dependency report to monitor potential risks. You can also now bring in the features workflow board to track progress, too.
While we were adding these options, we also created a new dashboard text panel. Use it to create section headers or add annotations to your dashboard, such as performance insights or events impacting the data. (The new text panel enhances the previous "text header" panel.)
Let's take a look at three examples of what you can do:
Showcase your roadmap plans
Build a dashboard to highlight key product themes. Let's say you want to communicate the major efforts of work the team is planning to tackle over the next six months. Include a starter roadmap to visualize strategic initiatives and epics. Adding a pivot report to show features grouped by epic is an effective way to show momentum as the actual work gets underway.

Add up to 20 panels per dashboard and arrange the layout just so with drag and drop.
Visualize release details
Coordinate the timing and details of upcoming releases in a single view. In the example below, we added panels to show a features roadmap and calendar report to convey exactly what features are coming and when. We also added a note to summarize how development is progressing. This dashboard contains everything we need to align cross-functional teams around the plan.
You can open any record to make updates directly from a dashboard.
Track delivery progress
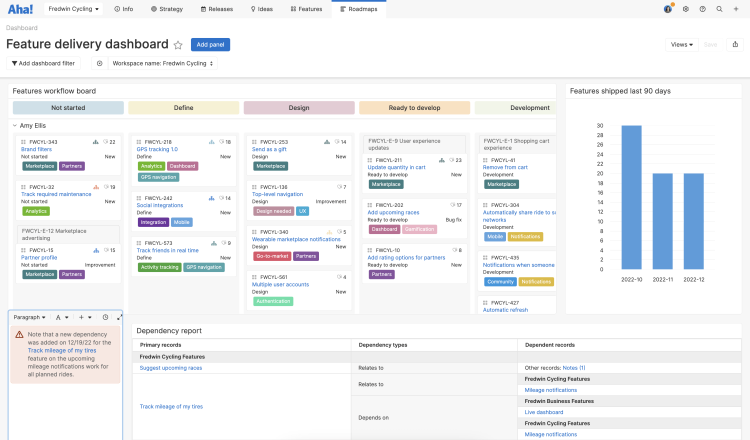
Monitor the team's progress and manage risk all in one place. Here we included the dependency report, features workflow board, and a chart of features shipped by month — with an annotation noting a new dependency to be aware of. We can use this dashboard to instantly gauge performance and identify any potential issues.

Filter dashboards by workspace, release, and initiative name to zero in on specific data.
Add all the visualizations you need to a centralized dashboard — so everyone can quickly gain the insights they need.
Once your dashboard is done, show the goodness to the team. Sharing options abound! You can add a dashboard to a note, include it in a presentation, or publish it as a webpage. Happy reporting.
Sign up for a free trial of Aha! Roadmaps
Aha! Roadmaps is the best way to set strategy, prioritize features, and share visual plans. It also includes the ability to create an ideas portal and crowdsource customer feedback. If you are interested in integrating your product and development workflows you can use Aha! Roadmaps and Aha! Developtogether. Sign up for a free 30-day trial or join a live demo to see why more than 600,000 product builders trust our software to build lovable products and be happy doing it.


