Visualize Voting Trends for Every Customer Idea
What makes one customer idea more valuable than another? No single data point can tell you. You need to consider multiple factors — such as an idea's popularity, voting trends over time, and even which companies have requested it. But it can take time to gather all of this information. This is why we continue to invest in helping you capture the insights behind every idea.
You can now track voting trends, popularity, related ideas, and more in the record details of each idea.
You could always see information about the total number of votes and proxy votes for each idea. This makes it simple to assess the overall popularity of a request. But sometimes you need a bit more context to understand the true value of an idea. So we made it possible to view more insights at-a-glance.
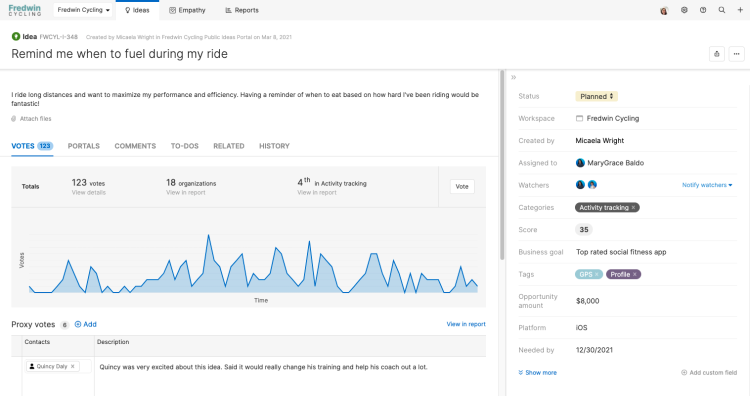
When you open the votes tab of an idea record, you will now see a beautiful chart that displays voting trends over time. By monitoring the ongoing popularity of a request, you can more accurately determine which ideas are resonating with customers right now. The higher the popularity, the more likely acting on it now will strike a chord with your audience. Even better? This new chart is available to all customers — whether you use Aha! Ideas or Aha! Roadmaps (which includes Ideas Essentials).
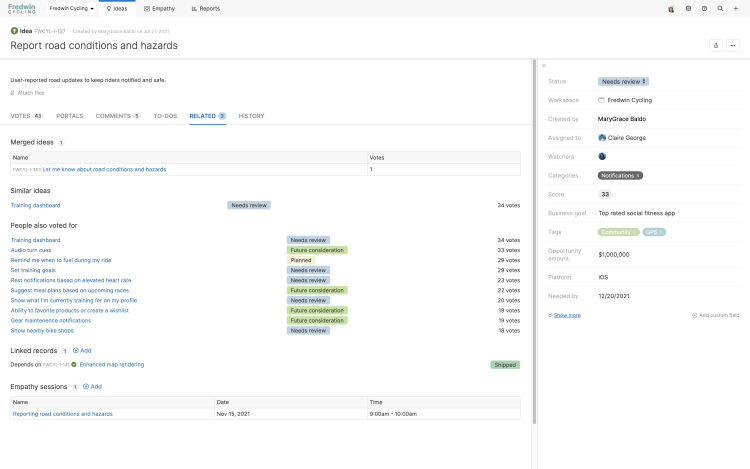
Customers on our Ideas Advanced plan can access even more details — including how many organizations have voted for the idea and how the idea ranks relative to others in the same category. If you are capturing opportunity value via proxy votes (either manually or using a Salesforce integration), you will see that value instead of the category rank. Then, visit the Related tab for an automatically generated list of similar ideas and ideas that are popular with the same set of voters.
Ideas Advanced is perfect for companies that want to expand the ways they collect feedback. You can access innovative capabilities such as portal translation, dynamic feedback forms, empathy sessions, and in-app community feedback. If you are already using Aha! Roadmaps and would like to trial these advanced idea management capabilities, email us at support@aha.io.
Let's take a closer look at how you can view these new insights:
Understand idea popularity
Quickly see whether an idea is growing in popularity or no longer relevant. You can visit the votes tab of an idea record to visualize voting trends over time. In the example below, you can also see that the idea has been requested by 51 organizations and ranks first in its category based on vote count. Click the 'view in report' link to go deeper — so you can discover other ideas submitted by those same organizations or dig into additional ideas within the same category.
See three relevant insights about each idea based on available data points.
Instantly view related ideas
You want to put your energy towards areas of improvement that will bring collective value. So it is important to track how an individual idea relates to other ideas in your portal. On the Related tab, you can view similar ideas, merge duplicates, and get a more complete picture of what customers want. You can also explore ideas that are popular with the same set of people to understand their broader needs.
Glean meaningful insights about every single idea — so you can prioritize the requests that matter most to your customers.
Today's updates make it easier to see the right data when you need it. So let these new insights fuel your curiosity and lead you to invest in the best ideas. And then tell us how we can continue to help you capture and assess customer feedback.
Sign up for a free trial of Aha! Ideas — grow your empathy.
Aha! Ideas is the best way to crowdsource feedback, engage a community, and develop customer empathy. If you are looking for a complete product management suite, choose Aha! Roadmaps. It includes Ideas Essentials for crowdsourcing feedback. Sign up for a free 30-day trial or join a live demo to see why more than 500,000 users trust our cloud-based software to build lovable products.


