Product Roadmaps vs. Gantt Charts
Gantt charts get a bad rap. Particularly among agile enthusiasts who think dates and dependencies stifle creativity and innovation. This might be true if your team works in a very linear way and each phase cannot be started until the previous is finished. Even though most teams do not work this way today, I do get where the skepticism comes from.
Gantt charts are seen as relics of very slow and inflexible work styles.
A product does not have a clear start and end date. And you need to move quickly in order to keep up with your customers’ needs. So it is natural to favor flexibility over structure. Building a successful product requires an environment that fosters creativity, innovation, and moving fast.
Product managers need a clear vision and a product roadmap informed by product strategy. And you need a high-level timeline for developing the features you have planned. Beyond that, the structure for how you visualize it all can be as loose as you want. Roadmaps give you that adaptability.
But at some point, meaningful teams need to manage cross-functional efforts with clear due dates. You can do this with a Gantt chart.
Think of any big launch or release. Without a detailed plan, things can get messy — fast. You might have dependencies such as internal training or documentation that must be completed before the next phase can begin. Gantt charts are an ideal tool for managing this type of work. This is why the Gantt chart is one of the more popular views in Aha!
You could say that roadmaps capture strategy while Gantt charts go deep into the timing. But there is more to it than that. Here are the main differences between roadmaps and Gantt charts:
Purpose of product roadmaps and Gantt charts
Roadmaps visualize a set of business objectives and the work required to achieve them. They provide big-picture direction and timing for everyday work. Roadmaps are most often used for strategic product planning, but some organizations use them to visualize the strategy for the overall business or major marketing efforts.
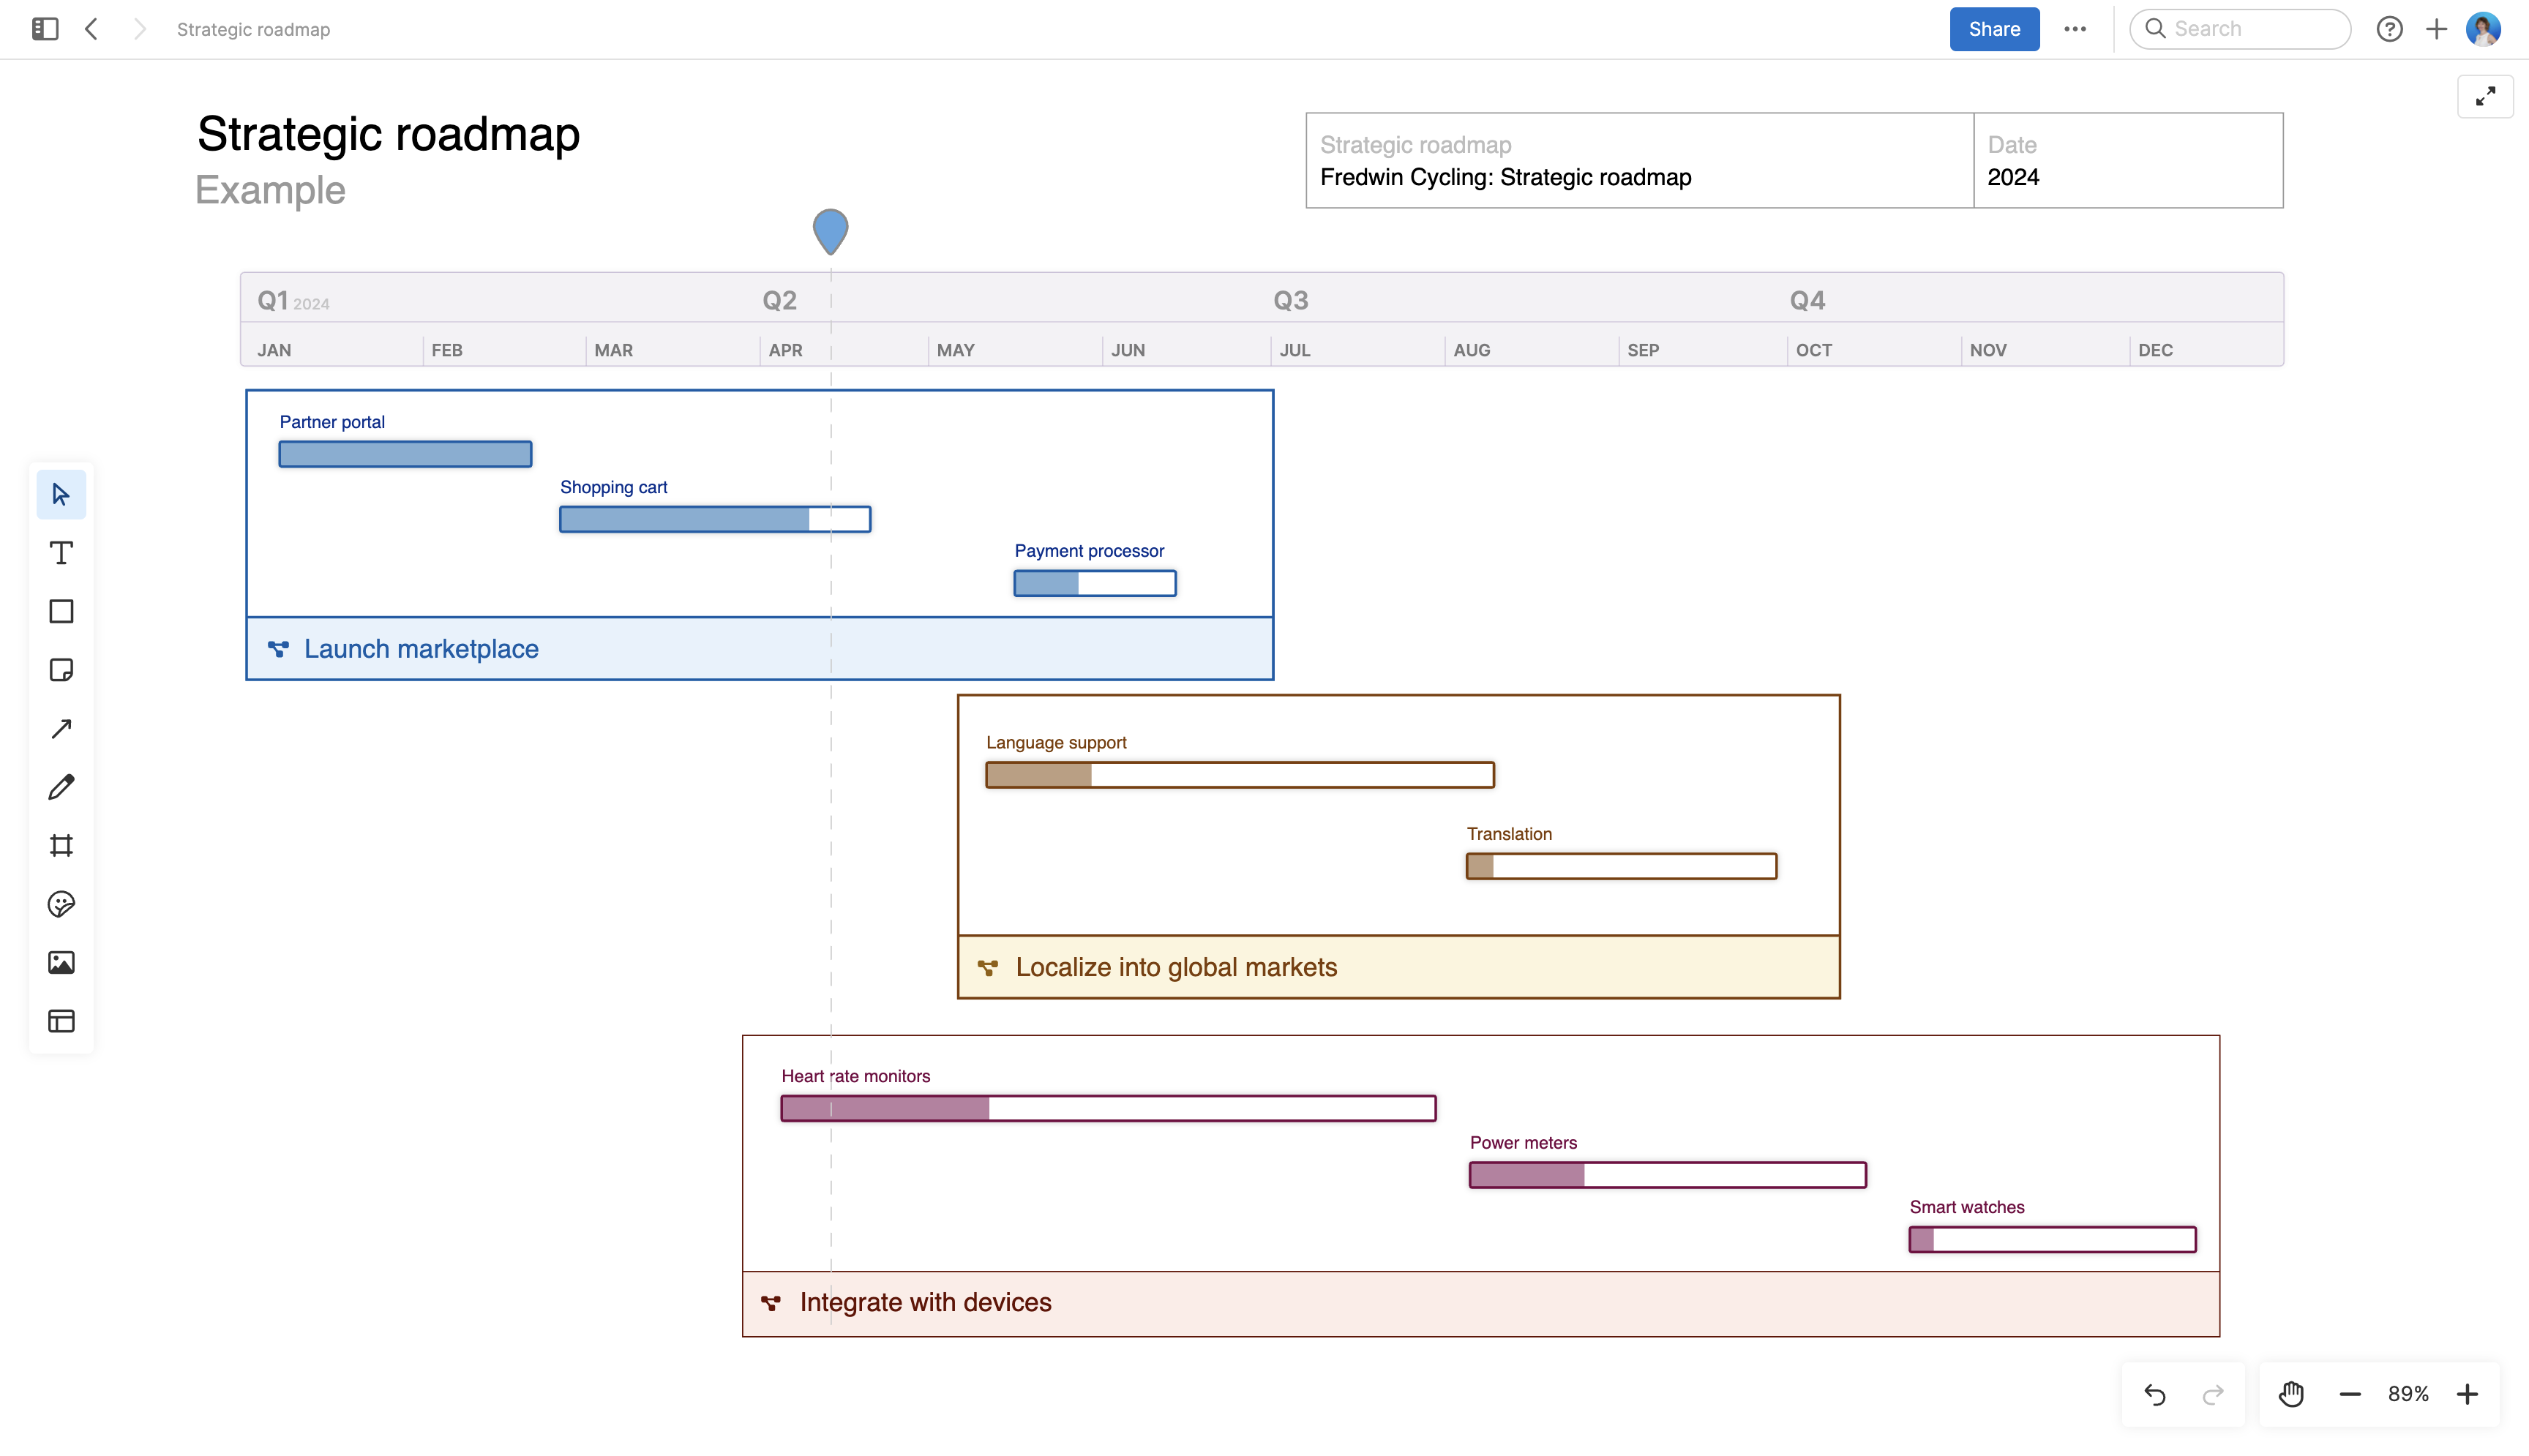
This is an example of a strategic roadmap created in Aha! Roadmaps. The three initiatives are color-coded and time-boxed according to the timeline at the top, which shows quarters and months.
Gantt charts visualize a timeline for work that must be completed linearly by a fixed deadline. Usually this work is also shown on your roadmap at a high-level, but a Gantt chart has every detail to keep broader cross-functional team members on schedule. Often these are complex efforts that impact most of the organization, such as product releases.
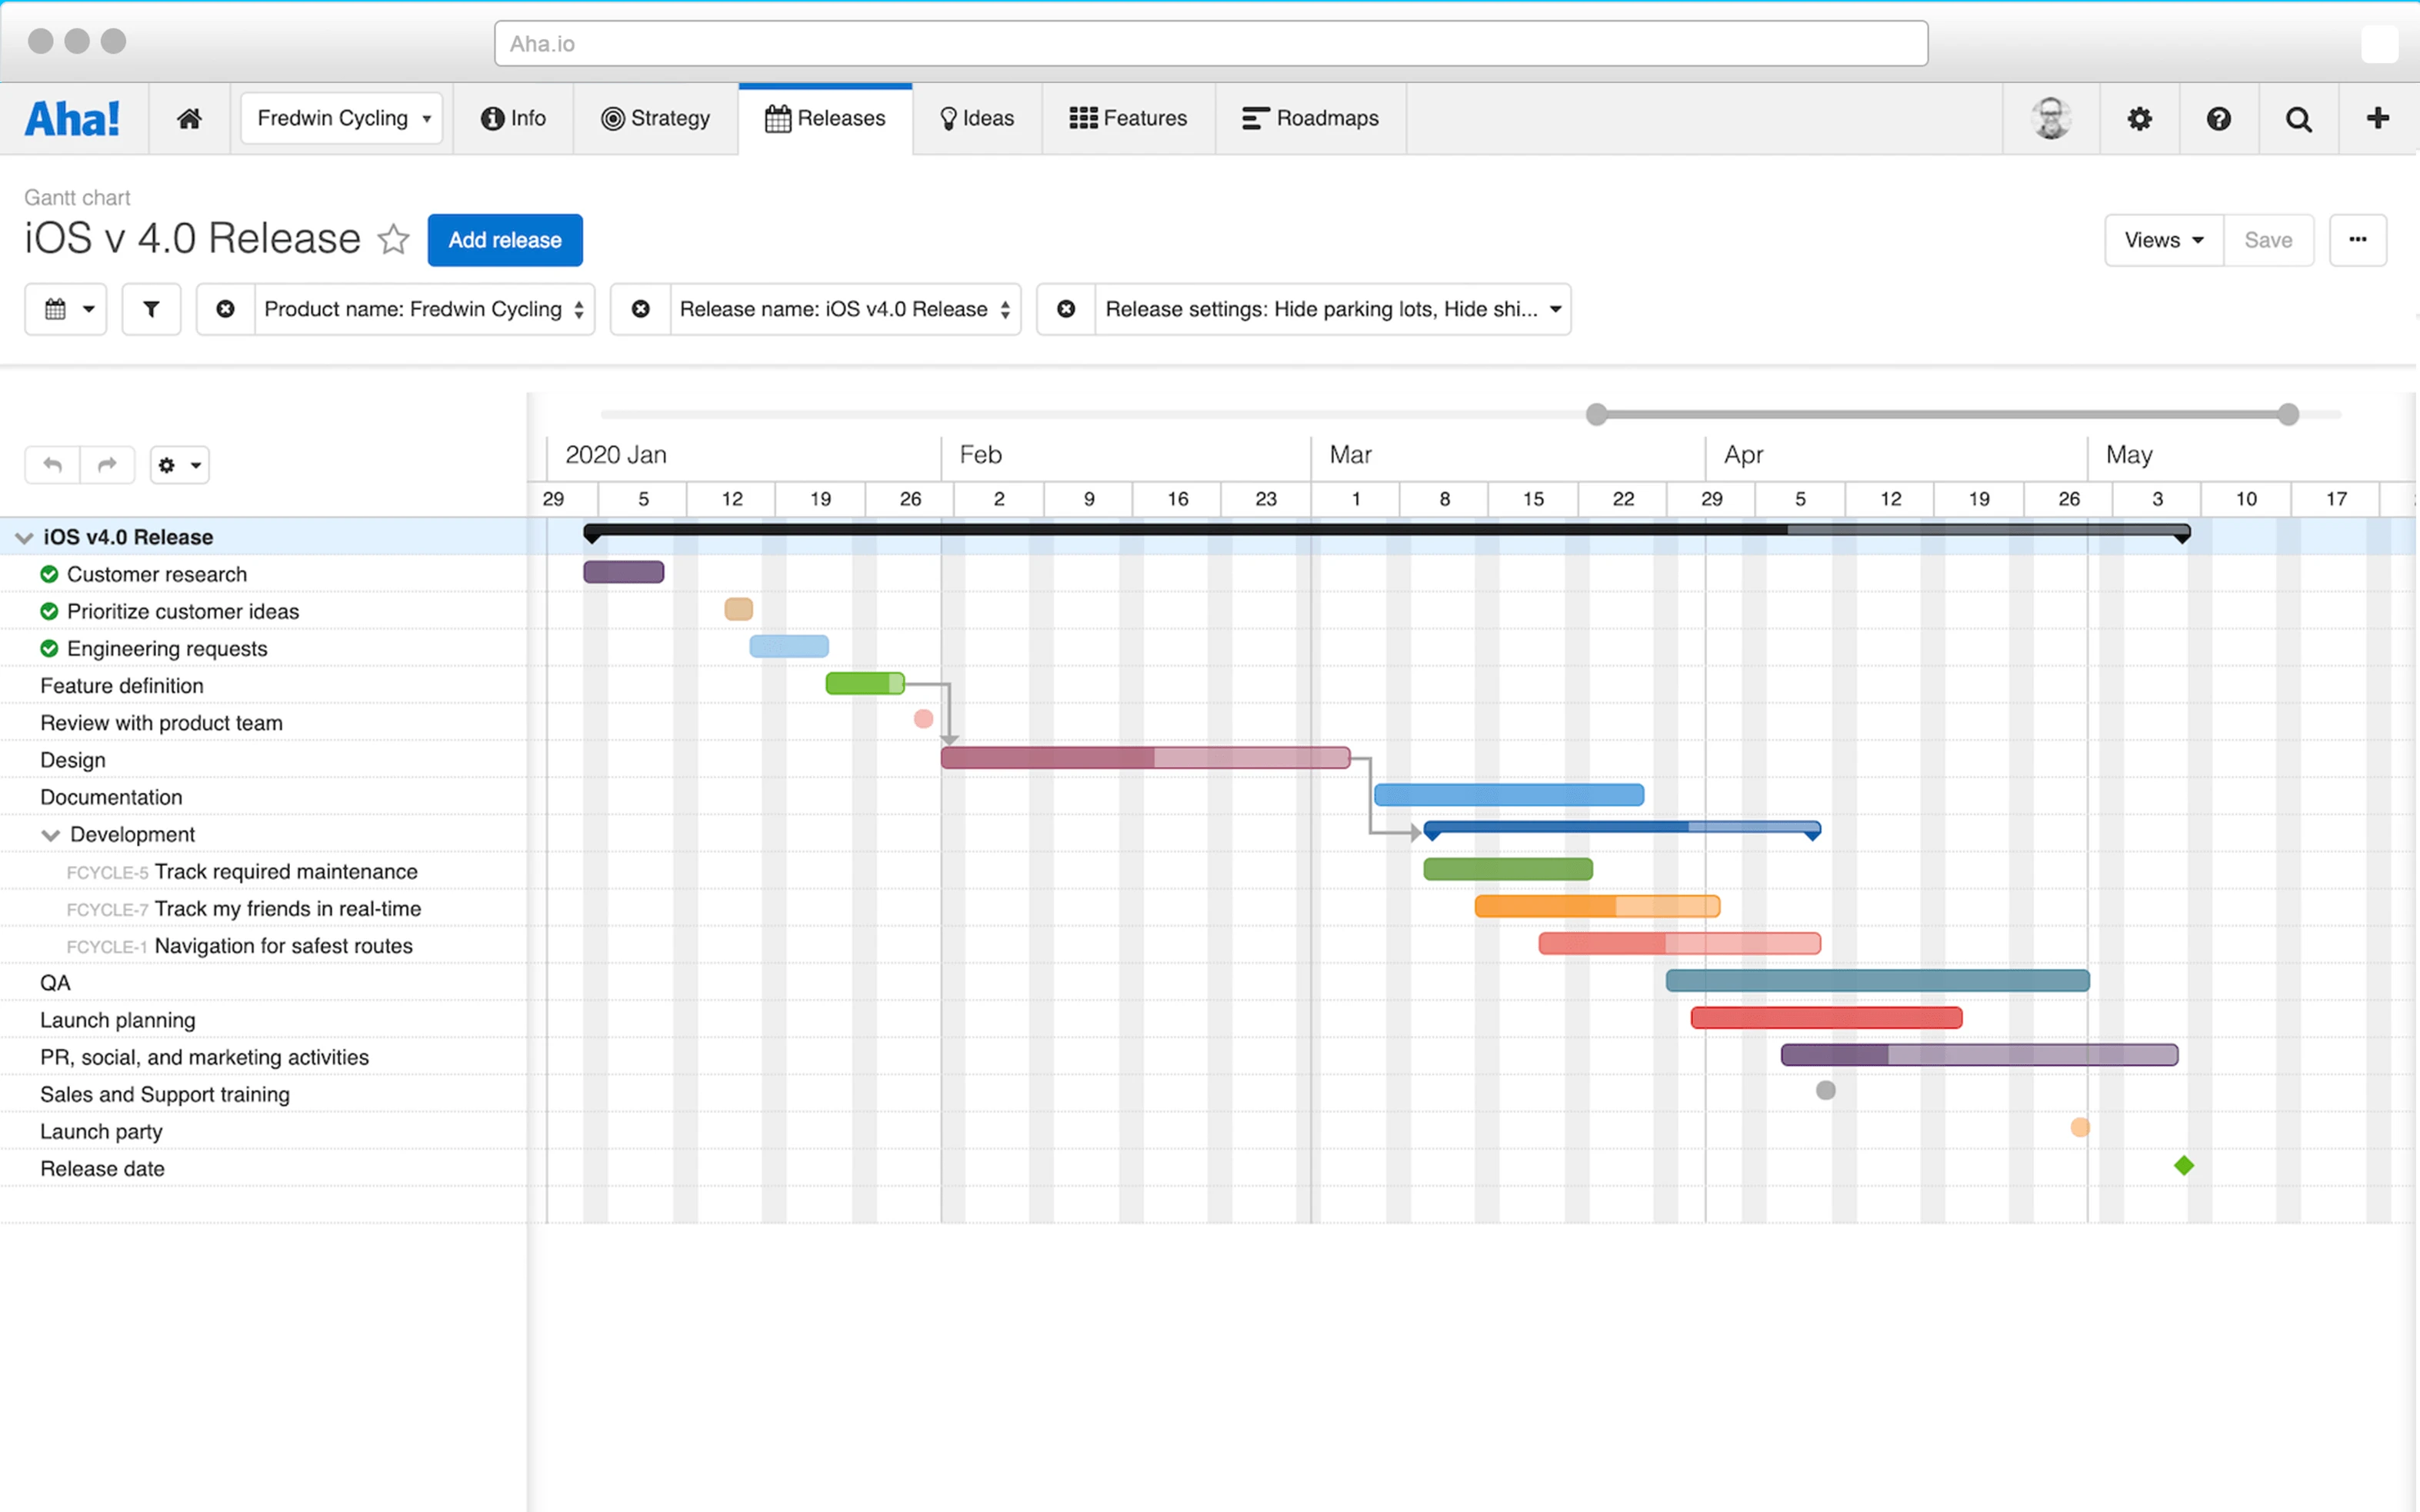
This is an example of a Gantt chart created in Aha! Roadmaps. Note the schedule above, divided into months and weeks, as well as the gray arrows which show dependencies between interrelated work.
Components of roadmaps and Gantt charts
Roadmaps define the “why,” the “when,” and the “what” behind your work. The “why” includes a vision, initiatives, and measurable goals for your product. The “when” is the high-level time frame for achieving your strategy. And “what” includes the features that will be developed within each release.
Gantt charts define the “when” and the "what" — but on a much deeper level. While a roadmap may show the general end date for and work included in a release, Gantt charts include all the phases of work required from all teams involved to meet that deadline. Gantt charts also include milestones and dependencies between work items that could impact your delivery date.
Read more:
Updating roadmaps and Gantt charts
Roadmaps are typically updated anywhere from every few weeks to once per quarter. Since roadmaps provide a high-level framework for strategy, timing, and work, they do not need to be updated as frequently as Gantt charts. Roadmaps are updated when goals change or big milestones shift — not in response to small changes to day-to-day work and timing.
Gantt charts are constantly refreshed as work progresses and dependencies change. Because the work is linear, deadlines for future phases must shift if one is missed — each one must be closely monitored. Real-time updates keep the entire cross-functional team informed on exactly when they need to contribute their part to the overarching project.
Your roadmap visualizes your strategic plan and Gantt charts provide the detail you need to bring it to life.
You only have one product roadmap. But that roadmap will contain many releases and hopefully some major launches that will drive real value for the business. So you will need a Gantt chart as well. Choosing the right tool for a successful delivery is just as important as what you have planned.
Your team is begging for a better way to work. Start a free 30-day trial.
Frequently asked questions about Gantt charts
Who uses Gantt charts?
Gantt charts are useful for planning and scheduling product launches and projects. Product and project managers use Gantt charts in a variety of ways to visualize what needs to happen and when. For example, project managers can use Gantt charts to manage project plans, coordinate project schedules, and keep team members in sync on the start and end dates for major project phases and deliverables.
What information is included on a Gantt chart?
Gantt charts typically include all the phases of work within a given project schedule. They may feature milestones, dependencies, activities, and tasks — including owners, assignees, and due dates. Work is plotted as horizontal bars across a timeline.
How can you build a Gantt chart?
If you want to build a collaborative, cloud-based Gantt chart, try Aha! Roadmaps. You can create a Gantt chart and other flexible roadmap views in minutes, collaborate with team members, and make adjustments in real time.


