Analyze cycle and lead time in a single report in Aha! Develop
New Cycle And Lead Time Report in Aha! Develop
There is no crystal ball for product development. And yet, engineering teams are constantly asked to predict the future. Product management wants to know when new features will be ready to launch. Customers want to know when their issues will get fixed. The best way to try to answer these questions with any degree of certainty is to use historical data to predict future output.
Use the new cycle and lead time report in Aha! Develop to understand how long it takes to deliver work — so you can more accurately set delivery dates.
Both cycle and lead time help you estimate: "How long will it take?" The key difference between the two is when you start the clock. Cycle time measures efficiency once work gets underway, while lead time considers how long an item sits in the backlog before the team even gets started. With today's update, we created a single report that gives you the flexibility to analyze both metrics in the same view — so you can better understand exactly how long it takes to get work done.
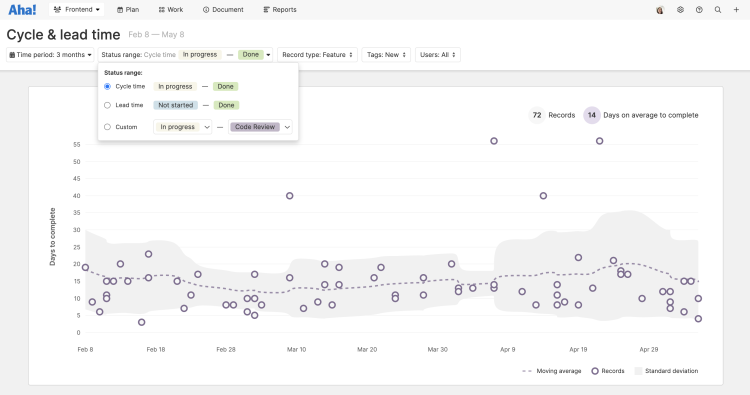
The new cycle and lead time report is available for teams using the Aha! Develop Advanced plan. You can find it in the Reports section of your account. Choose the time period you want to view, such as six weeks or three months. Then, select cycle time, lead time, or drill in to specific stages of your workflow with a custom status range. You can even apply filters to zero in on work items of a similar size and type.
Individual work items are represented as dots on the report and a trend line shows the average number of days it takes to get work done over time. See the current average completion time and the number of records analyzed at the top right of the report. Hover or click on any dot on the chart to get more details about the work item.
Here are a few ways you can use the new report:
Track cycle time for features
Let's imagine you want to plan future release dates more accurately. In the example below, we chose cycle time and filtered by features. Now we can see it takes 14 days on average to move work from "In progress" to "Done." This information will help us set more accurate expectations with the product team and deliver new features on time.
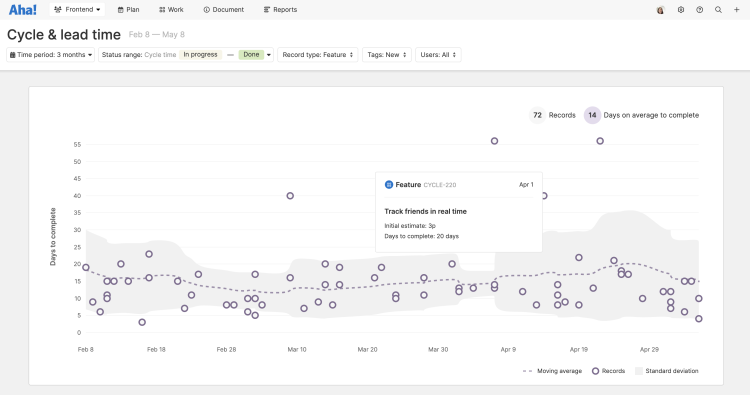
Click on any dot on the chart to get more details on the work item.
Investigate workflow stages
Find ways to boost productivity — by measuring the time it takes for work to progress through a specific stage in your workflow. Here, we used a custom status range to focus on how long work items are in testing. The average time is 6 days and we can see that there is a wide range of variability — from as little as one day to as many as 16. We can share this data with the team and identify ways to improve predictability in our testing process.
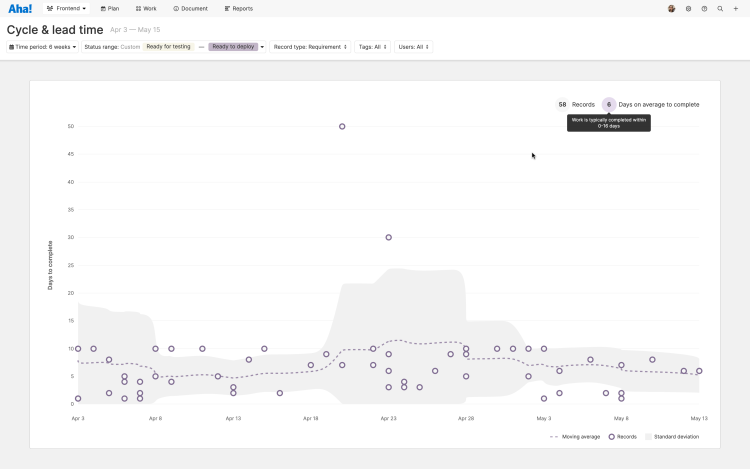
View delivery times across the entire team or apply a filter to focus on work completed by individual team members.
Measure customer response lead time
Lead time starts from the moment a request is made. It helps teams understand how long work waits in the backlog, as well as how long it take to actually complete it. In the example below, we are analyzing our responsiveness to customer support issues. We can see that the average lead time for support escalations is five days. Now we can find opportunities to improve our process and increase customer satisfaction at the same time.
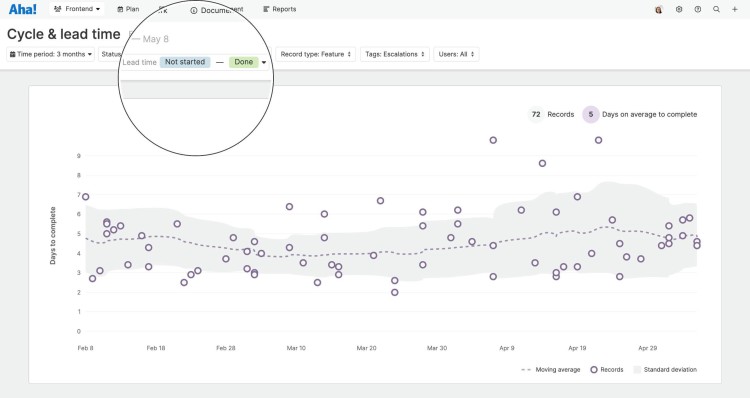
Use an importer extension to bring escalated customer issues from your support tool into Aha! Develop.
Gain confidence in your ability to predict and improve the future with the new cycle and lead time report.
You will love how easy it is to understand time-to-deliver at each stage of your development process. Be sure to dig deeper into your data with filters and tags — so you can uncover the insights you need to move work forward faster.
Sign up for a free trial of Aha! Develop
Aha! Develop is a fully extendable agile development tool — prioritize the backlog, estimate work, and plan sprints. If you are interested in an integrated product development approach, use Aha! Roadmaps and Aha! Develop together. Sign up for a free 30-day trial or join a live demo to see why more than 600,000 product builders at companies of all sizes trust our software to build lovable products and be happy doing it.


