More Ways to Organize and Filter Your Dashboards
You can pack a lot of information into a dashboard. And many of you do. You love bringing together beautiful roadmaps, list reports, pivot tables, and charts — to monitor everything from strategic progress to team accomplishments in one place. With so much information to share, sometimes you need to add a touch of simplicity to effectively tell your story.
Reporting dashboards in Aha! Roadmaps are now easier to organize — with new text headers and the ability to filter data by initiative and release.
These enhancements give you more control over how you use dashboards and display data. For instance, let's say you are presenting progress and key results to a group of company leaders. Dashboards let you bring multiple reports together to provide a full story. But you also need to convey your points clearly and succinctly. Adding many reporting panels to a dashboard is useful — but it can be challenging to scan and digest.
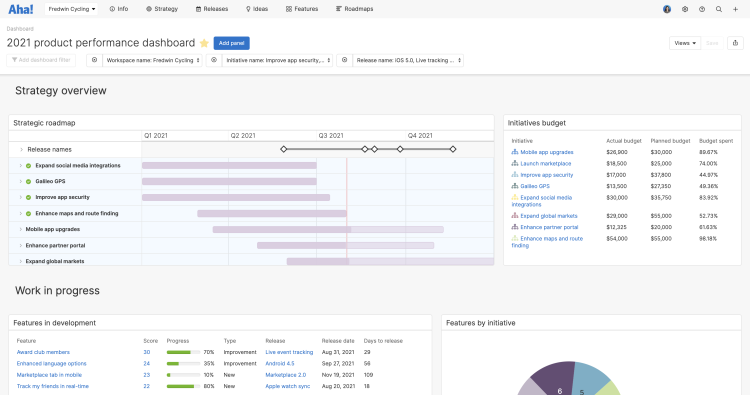
Now you can use text headers to visually divide reports and show how groups of panels on your dashboard are related. This makes it easier for your audience to understand the overall structure of the dashboard and navigate to the information they want to see.
We also added more filtering options to dashboards so you can zero in on specific data. You could already filter dashboards by workspace — now you can filter by initiatives and releases too. This way, you can configure one dashboard with shared KPIs, then go deeper into the details of the work as needed.
Let's take a closer look:
Organize with sections
Make your dashboard more viewer-friendly. Add up to 20 panels, then drag and drop to arrange them how you like. Next, add text headers to provide context for each section. In the example below, our sample reports are grouped by strategic overview, work in progress, and customer feedback.
You can edit, resize, and move text headers just like other dashboard panels.
Refine your view
Sometimes you want a holistic view of product and team performance. Other times, you need to view data that is only relevant to a particular area of focus. Add initiative and release filters to your dashboard to monitor both. Below we have narrowed our view to an initiative related to launching a new marketplace. Data across all panels on the dashboard automatically adjusts to display that initiative's details.
You have the option to override the dashboard filter in the panel configuration settings.
Quickly organize and access the data you need — to better understand strategic plans and progress.
Dashboards are a powerful way to convey momentum and success. Use these new dashboard enhancements to more easily gain the insights you need. Then show off the dashboards you create — we love to see how customers like you track and share product metrics.
Sign up for a free trial of Aha! Roadmaps — plan the future
Aha! Roadmaps is the best way to set strategy, prioritize features, and share visual plans. It includes Aha! Ideas Essentials for crowdsourcing feedback. If you are not already an Aha! customer, sign up for a free 30-day trial or join a live demo to see why more than 500,000 users trust our cloud-based software to build lovable products.


