Just Launched! — Export Your Product Management Data to Excel
There is no love lost between product managers and spreadsheets. It is not the fault of Microsoft Excel though — one of the most powerful applications ever built. It was just designed for complex data analysis — not product management. But while Excel falls woefully short as a product management solution, it still has a place in your toolkit. And when you do have to use Excel, you want to be able to get data into it easily. We get it.
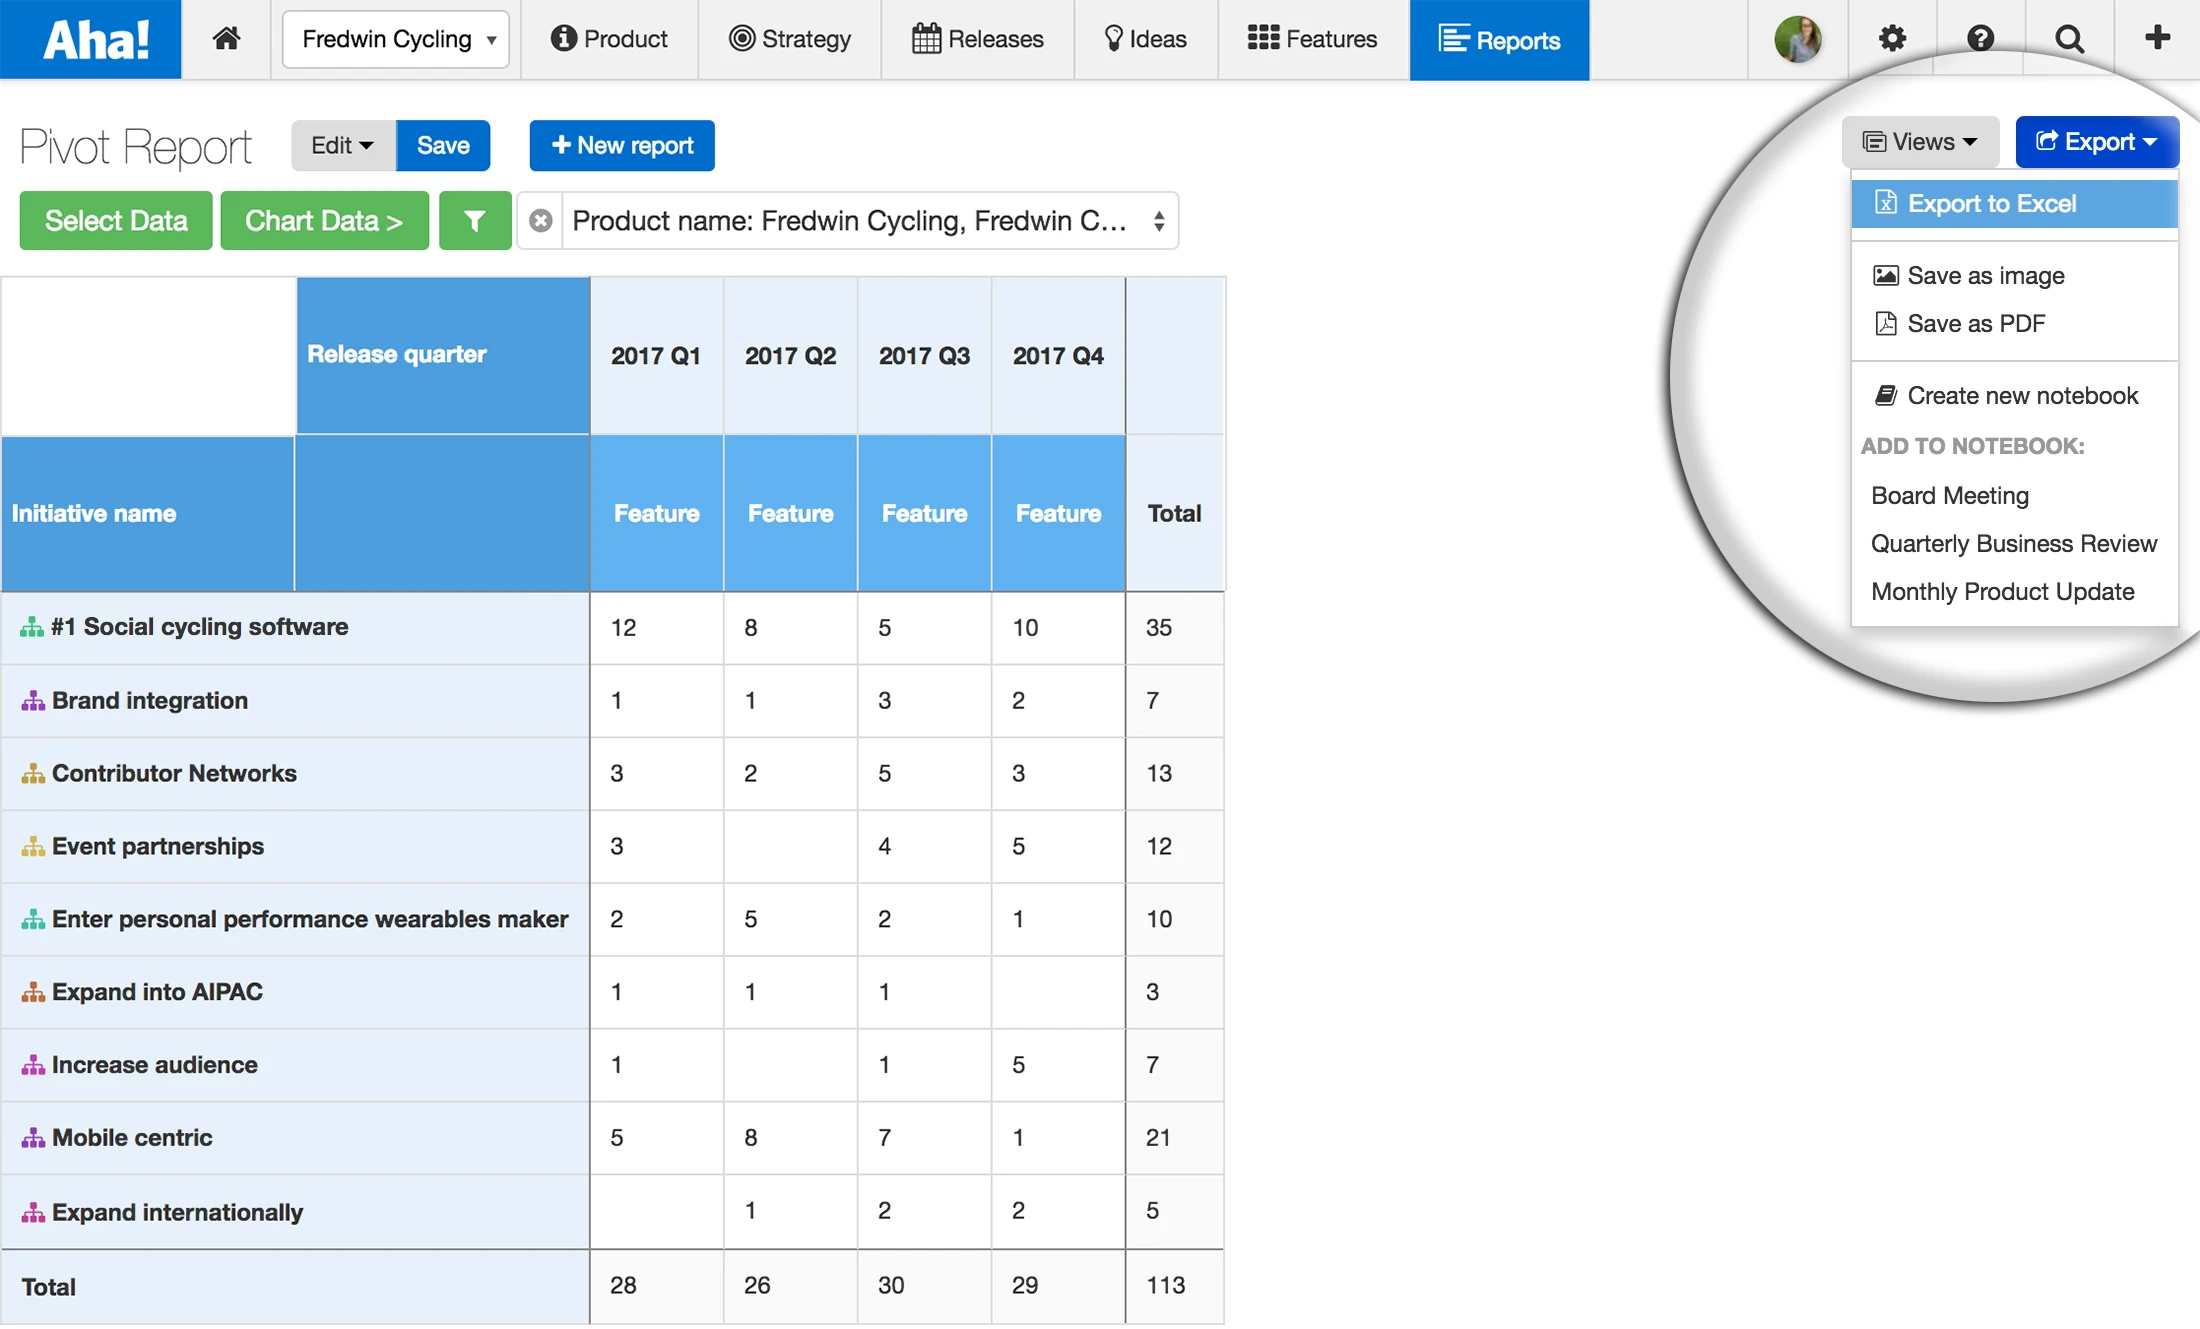
With our latest update, you can export any list view or pivot table in Aha! directly to Excel — without losing your formatting.
If you previously used our CSV export option for lists, you will appreciate that the new XLS export offers the added convenience of not having to reformat rows and columns. The layout of your data looks exactly the same in Excel as it does in Aha!
As the single source of truth for your product management data, Aha! makes it easy to build most of the reports you need. But there are still those occasions that require you to flex your Excel muscles — such as when you need to combine information from multiple systems or use an advanced formula.
We thought it would be helpful to suggest a use case. So, here is an example of how you can use the new export to Excel capability:
Identify features shipped by initiative Imagine you want to show the impact of your strategic initiatives on customer growth this year. You want to correlate the features you shipped each quarter with new customer sign-ups. The only challenge is that customer data is stored in your company’s CRM tool and your product data is in Aha! To start, create a pivot table in Aha! that shows features shipped each quarter that are linked to your strategic initiatives.
Analyze your product data in Aha! using powerful list views and pivot tables.
Combine sales data from your CRM Next, see how those strategically aligned features impacted customer growth. To combine your product data with your customer data, export the pivot table from Aha! to Excel. Add a row to show the number of new customers each quarter, and then create a chart to visualize the correlation.
Bring your product data from Aha! into Excel for deeper analysis. The chart correlates the impact of work related to our “#1 Social cycling software” initiative with new customer growth.
Share your findings Now you have a product story to share with the team. Add an image of the chart you built in Excel to your Aha! Notebook — all of your product information is back in one place.
Create a compelling presentation by adding images to Aha! Notebooks.
Product managers deserve a purpose-built tool like Aha! — but sometimes you need to gather data from other sources to complete a more sophisticated analysis or craft a compelling product story.
So no, we are not suggesting that you go back to the dark ages and build your roadmaps in Excel. But with this new XLS export capability, you can leverage Excel to get even more value out of your Aha! product management data.
Sign up for a free Aha! trial — be happy All Aha! customers can use the new export to Excel capability. If you are not already an Aha! customer, you may want to sign up for a free 30-day trial of Aha! now to see why over 150,000 users trust Aha! to set product strategy, create visual roadmaps, and prioritize releases and features.
Aha! is a trademark of Aha! Labs Inc. All other company and product names may be trademarks of the respective companies with which they are associated.


