Improving the editing experience in Aha! whiteboards
Our team at Aha! loves using Aha! software. It's not only a great way to build our own lovable product, but it also helps us to find rough edges before customers do and develop empathy for our users.
So when one of our principal engineers, Maeve Revels, wanted to share some insights on our internal data architecture, an Aha! whiteboard was the obvious choice — whiteboards make it straightforward to build out a rich visual presentation and navigate through the frames in sequence. The end result was a whiteboard with thousands of shapes illustrating complex data relationships, including how we use tools like Kafka and Redis, plus the scale at which we operate them.
Maeve's presentation was great, and we all learned a lot! But as an engineer on the team responsible for our whiteboard functionality, I wondered what the editing experience was like and whether it could be improved.
When I looked at the whiteboard later, sure enough, I noticed some laggy rendering — particularly when dragging or bulk-updating a large number of shapes. I was motivated to try to fix it. And on the Aha! team, this is encouraged — we empower every engineer to take ownership of our product, fixing or improving it as we go. So I started digging into the code.

The initial investigation
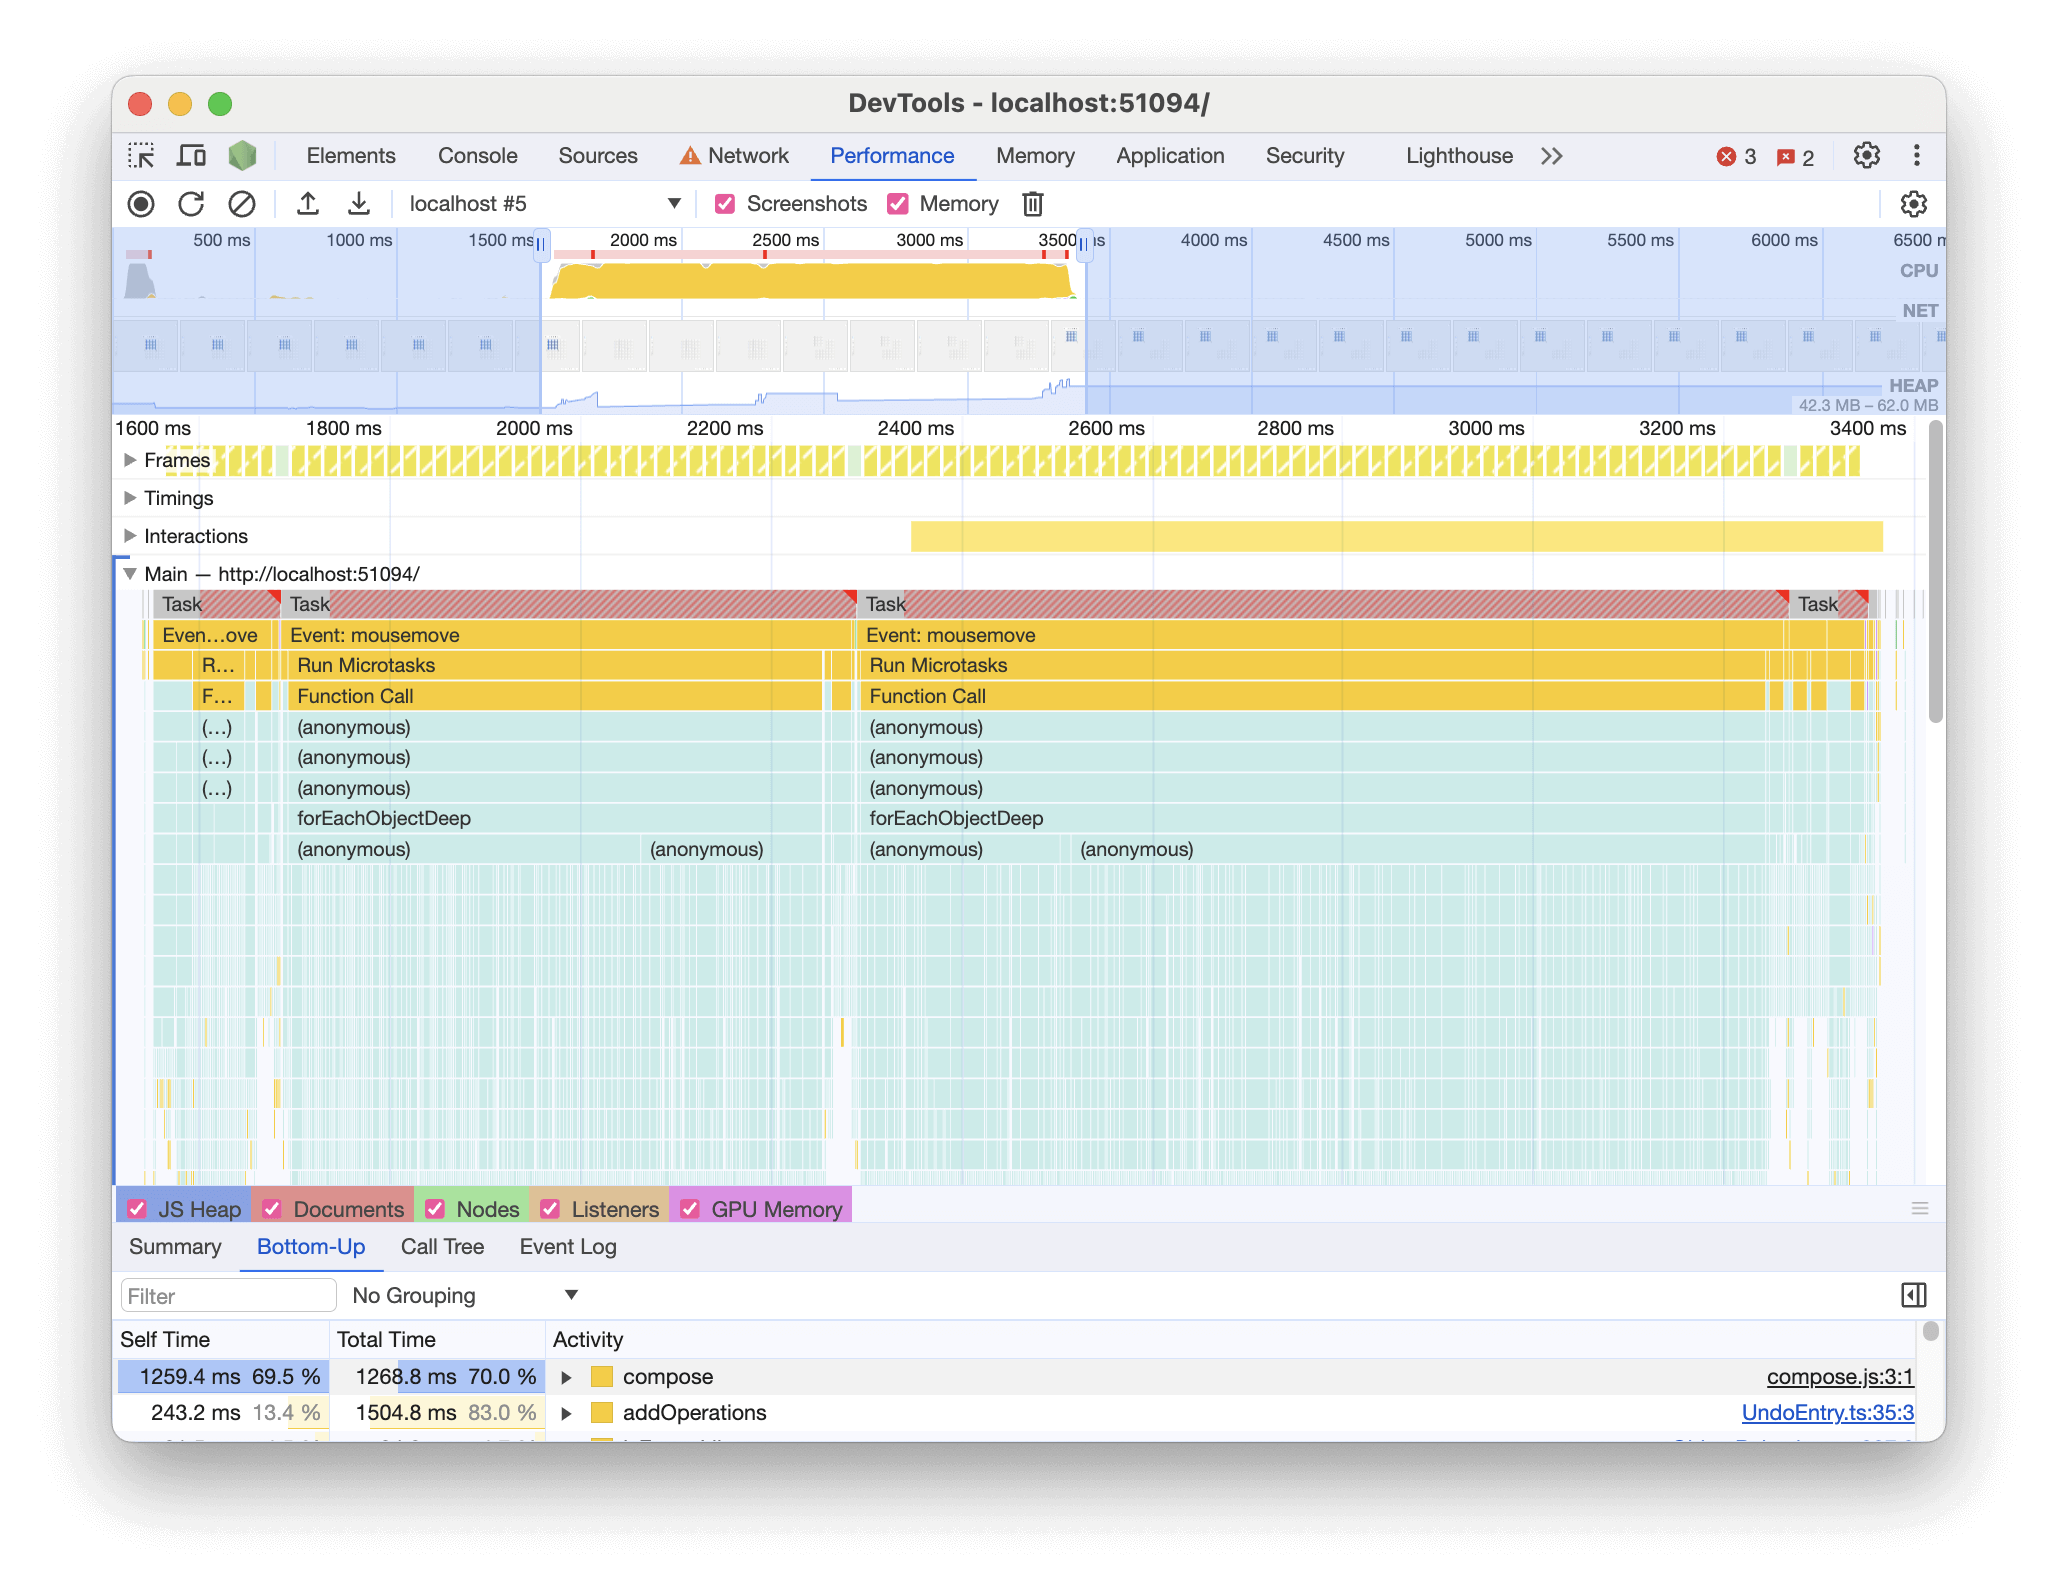
First, I created a representative whiteboard for testing with hundreds of shapes, then opened Google Chrome's performance tools to run a profile on our javascript code while dragging. Browser performance tools are a powerful way to diagnose this sort of issue and well worth learning to use. I captured some screenshots and notes on performance for later comparison.

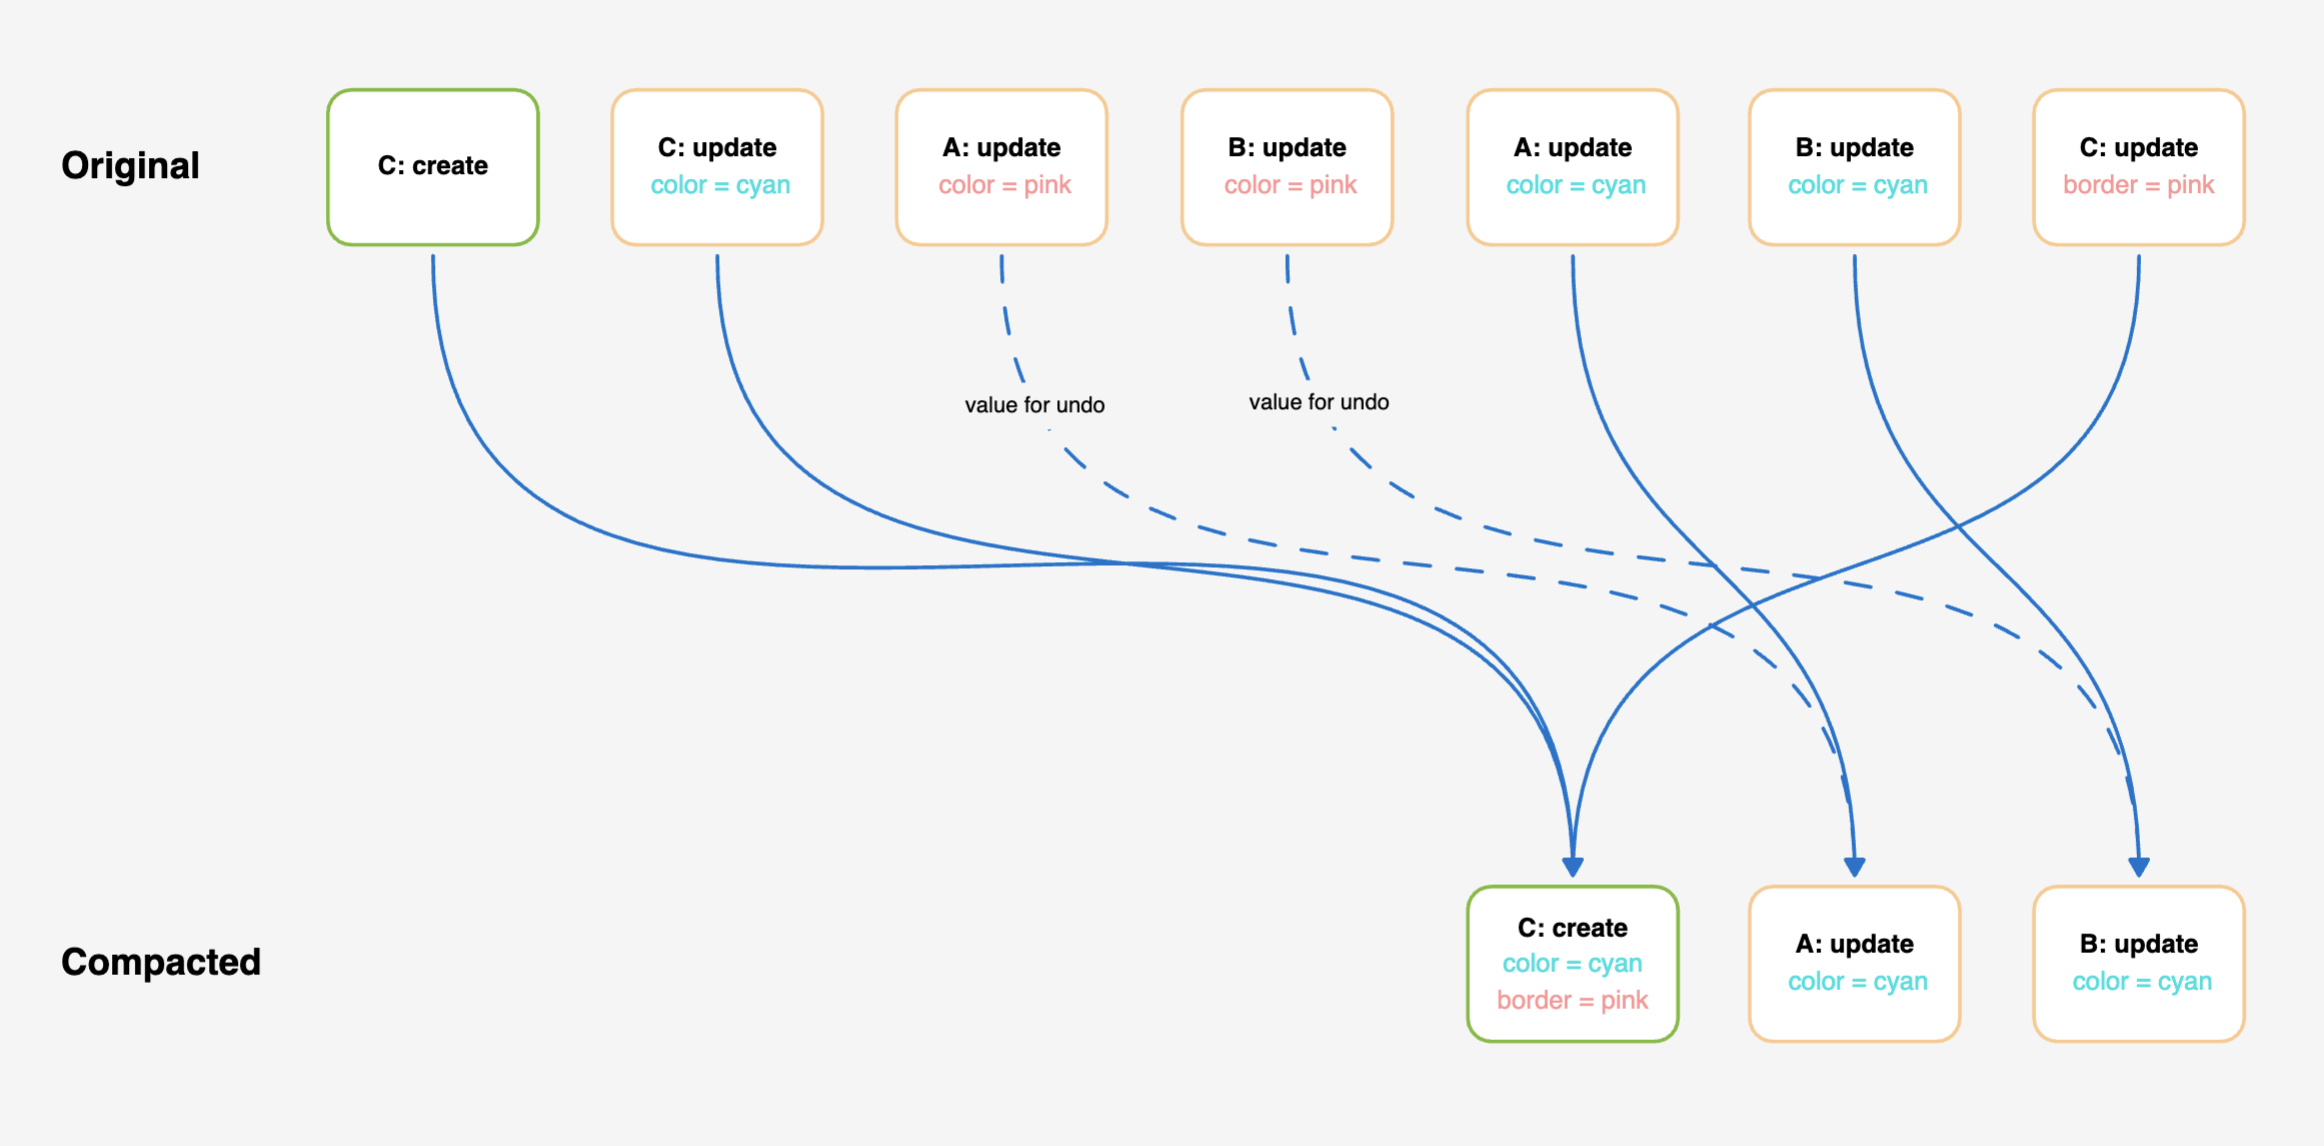
Chrome's flame graph showed me an obvious culprit — a compose function that was called thousands of times as I dragged the shapes. Reading the code, I realized it contained a nested for loop — the classic marker of O(n2) computational complexity. Essentially, the algorithm takes an array of whiteboard operations (each representing a change) and removes redundant operations. For example, if an object's position moves several times in quick succession, we only need to keep the last operation. Another example is when an object is created and then updated. We can combine the updates into the original creation. The compose function did this by iterating through the array, and for each item, iterating again to check for related operations.

Addressing the problem
The first problem was the algorithm's inner loop — an O(n) operation by itself. If I could make this O(1), we could potentially get a big gain right away. The problem was that we had to essentially scan the array for matches, so we needed some sort of index.
If you've ever optimized a database query, this'll sound familiar. The neat thing is that it really is the same problem in a different context. Just as database access patterns determine the ideal table and index structure, we can use the same mental model to transform our data structure on the frontend for efficient access. In this case, I used a nested Map which I could represent like this in Typescript:
type OperationMap = Map<
  string, // id of updated object
  Map<
    string, // property name to update
    Operation // update details
  >
>

const refs: OperationMap = new Map();

// once populated, we can look up all operations for an object like this
const allOperations = refs.get(objectId)

// or a specific object property update
const colorOperation = refs.get(objectId)?.get('color')
Initially, I wrote a two-pass solution with a full iteration to fill out the Map and a second to do the work, referring to the Map as needed. I quickly realized though that I could eliminate the extra iteration and create the Map on the fly. This worked because the algorithm really only needed to look at later operations. And by iterating in reverse, I could ensure these were already processed.
const refs: OperationMap = new Map();

for (let i = operations.length - 1; i >= 0; i--) {
  const op = operations[i];

  if (op.type === 'update') {
    // check for later matching ops (stored already because we're iterating in reverse)
    let updatesForObject = refs.get(op.id);
    const updateForProperty = updatesForObject?.get(op.property);

    if (updateForProperty) {
      // if it's updating the same property, update stored op for undo, and delete
      updateForProperty.previousValue = op.value;
      deleteOp(op);
    } else {
      // otherwise store op - this is the latest update for that object/property that we
      // want to keep
      if (!updatesForObject) {
        updatesForObject = new Map();
        refs.set(op.id, updatesForObject);
      }
      updatesForObject.set(op.property, op);
    }
  } else if (op.type === 'create') {
    // find any later matching update ops
    const laterUpdates = refs.get(op.id);

    laterUpdates?.forEach((update) => {
      // copy assignment to create op, and delete update
      op.properties[update.property] = update.value;
      deleteOp(update);
    });
  }
}
To ensure correctness, I was able to lean heavily on new and existing unit tests, which were straightforward to write as the code under test was written as a pure function. This made it really easy to test and verify various scenarios without mocking or complex test setup.
Did this fix the problem? Yes and no! When I opened my whiteboard and repeated my test, performance had definitely improved, but not as much as I had hoped — so I dug into the code again. This time I was focused on how we were calling the function as it seemed too frequent in the performance profile. I suspected many of the calls could be combined into one to get much better mileage out of the improved algorithm.
Iterative improvement
Looking at the context, I identified two areas in our collaboration and undo code where we called the compose function for every new operation. If we could instead defer these calls and only compose once for say, every 100 operations, we should see a big gain. But due to the complexity and critical nature of this area, I wanted to minimize the breadth of the change.
To achieve this, I employed two strategies:
- Buffering: The simplest option was to collect operations in a buffer, and only combine them once it reached a threshold. This worked well in our collaboration code where operations were already collected in-memory and periodically sent to the server via a websocket message.
- Just-in-time composition Operations collected for undo can be read at any time, so waiting to reach a threshold wouldn't work. Instead, we collect them in a buffer and compose them only when they are read. This kept the undo code's external interface unchanged, which was crucial to minimizing the wider impact.
With these two techniques in place, performance improved dramatically — getting the full benefits of the new, optimized O(n) algorithm. Now, it's possible to smoothly drag hundreds of shapes around the canvas without noticeable lag.
Unexpected consequences
With our whiteboard code now much more performant, I ran into an unexpected problem — dragging a large group of shapes caused the websocket connection to drop. It turned out that we had a 1mb limit on the size of websocket messages, which we'd never reached. But the increased client-side performance made the browser suddenly capable of producing operations much faster than before. While we could have safely increased the server's limit, we chose to implement a corresponding client-side limit to keep websocket message size in check.
Takeaways
When optimizing performance, there's almost never a silver bullet. Even in this case where we quickly identified an inefficient algorithm, addressing it did not solve the issue completely — the biggest gains came from the comparatively mundane change to defer a function call. In these types of situations, the key is to stay curious, focus on the measurable impact of your work, and always take an iterative approach to improving your code.
You might also be wondering why we didn't write more performant code in the first place. And that's a fair question! When the code was initially written, performance wasn't an issue — that only became a problem much later when people started creating more complex whiteboards. Time spent upfront on optimization could have been wasted if our product evolved in a different way, so deferring this work helped us to build a Minimum Lovable Product sooner. That said, it's worthwhile to keep concepts like computational complexity in mind, so long as it doesn't lead to increased code complexity and development time.
Finally, it's worth noting that having well-written unit tests was critical to refactoring the original algorithm with confidence. Having the algorithm contained in a pure function with a simple interface made testing a breeze, because the tests only had to consider the inputs and outputs, with no changes needed when we refactored the implementation.
